Knowing how to create a social media report is a task that can be tedious and unproductive if not done in the right way, so it is important that every social media manager knows how to carry it out in a professional and error-free manner.
If you are wondering when it is appropriate to perform a social media report within the field of social media digital marketing trends, I will tell you that any action or strategy that is worthwhile for the company, will also deserve a report. After all, tracking and analyzing performance are the only ways to really know the results of our social media strategies.
Social media reports help us to keep track within the company by telling us the real value of the social marketing efforts made by each member of the team. It is crucial to possess evidence that demonstrates the significance of our efforts to the organization, ranging from the employees’ morale to expanded budgets and team development.
It’s also useful when things aren’t going as well as we’d like, as social media reports can help us learn from our mistakes and get our social media marketing strategy back on track.
What is a Social Media Report?
A social media report is an internal document that provides and monitors significant information about our social media undertakings.
It can actually be anything from a simple list of numbers in a spreadsheet, to a fancy slideshow full of analysis. It all depends on the purpose of the report and who your audience is.
Moreover, it is likely that we will need to create several of them in order to adapt them to different audiences or objectives.
How to create a Social Media Report?
It is important that the social media marketing report includes the data and analysis that the recipient of the report needs to understand social media performance as a whole, no more and no less. The recipient of the report can be our boss, teammates or even ourselves.
In general, social media reports tend to be much more detailed for our colleagues than for the head of the company. In fact, it is advisable to maintain an even more comprehensive report for personal reference.
Your social media report should also be pleasing to the eye and easy to follow. There is no need to overdo the formatting or include unnecessary details. It’s best to let the data tell the story.
How to start a social media report
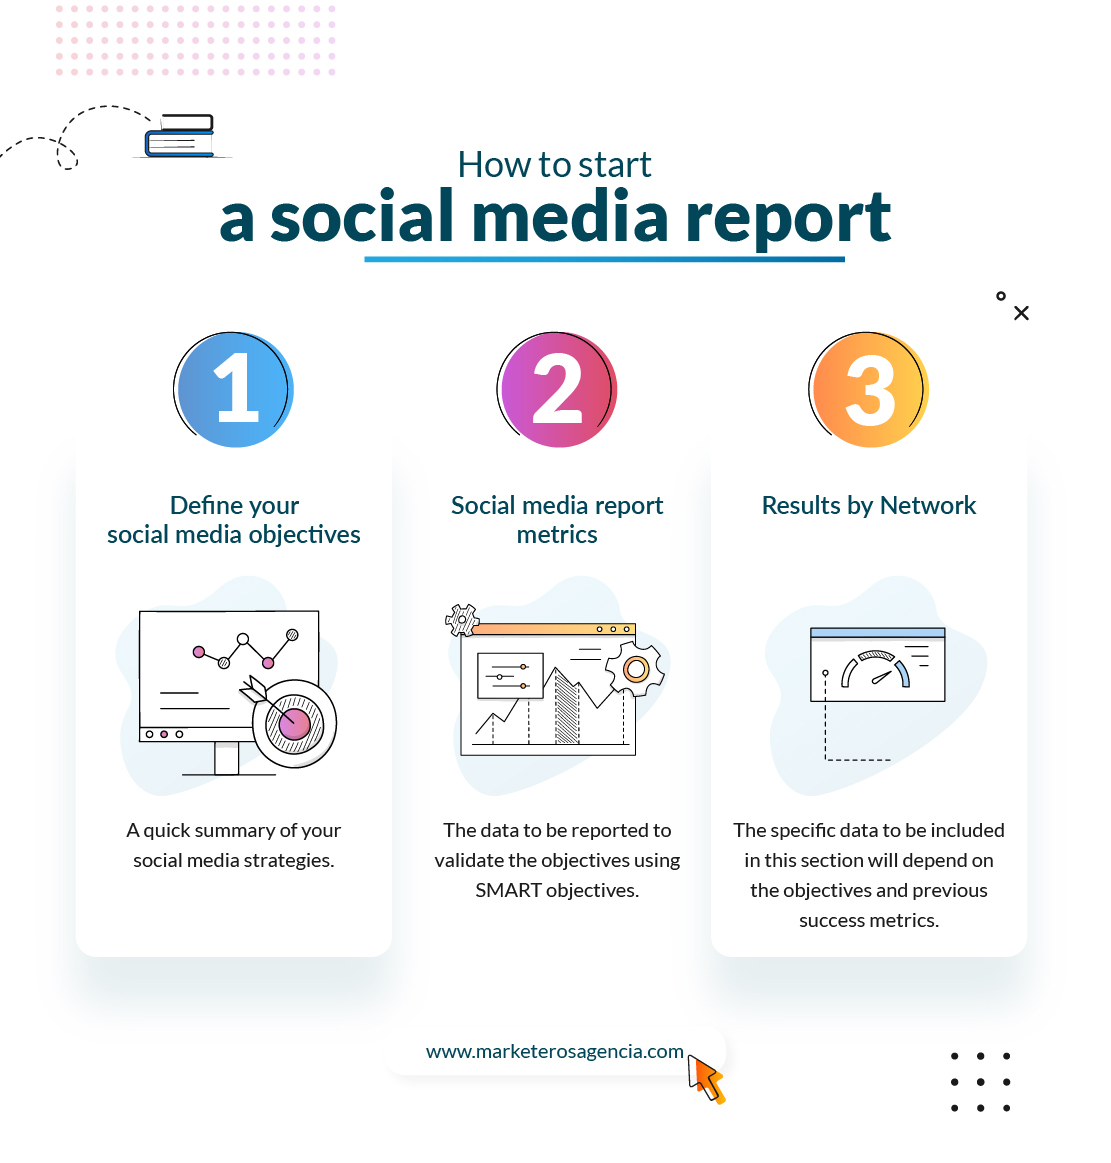
We will begin our social media report with a quick summary of the social media strategies undertaken. This provides a context so that the recipients of the report know what to expect during the rest of the report.
It is here, at the beginning of the report, that we should state the overall purpose of our social activities in relation to the business strategy. You will go into more detail in the following sections of the report, but at the beginning just focus on the following questions:
Does the company make use of social media as a customer service channel? Does it engage in social commerce? Does it have brand awareness? All of the above?
It’s also important that we make sure to highlight in the social media report any changes in strategy since you last submitted it, including any new channels you’ve incorporated into your social media strategy.
Defining your social media goals
Now it’s time to get more specific in our social media reporting. We’ll take the targeting strategy we highlighted in the first section and break it down into clear, measurable objectives. It’s generally a good idea to use the SMART goal-setting framework, as it ensures we create goals that are easy to both track and report on.
The quantity of objectives to be incorporated in the report depends on the maturity of your social strategy and the size of your team. If this is your initial social media report, it is recommended to limit the number of objectives to a few. As you start tracking, learning, and achieving success, you can gradually incorporate more goals.
Social Media Report Metrics
For the report metrics we will focus on the data that will be reported to validate the goals by making use of SMART goals, which have built-in success metrics. These can be focused on two different objectives, on the one hand we have metrics for Ads, and on the other hand metrics for organic.
For example, if our goal is to increase the number of leads generated by 25% during a quarter, we will have to report on the number of leads generated. In reality, the metrics to take into account will be different depending on each project, but some of the general metrics that our report should include are:
– Number of leads generated.
– Number of conversions.
– Total revenue generated.
– Total return on investment (ROI).
– Total spend.
– Share of voice on social networks.
– Social sentiment.
When using social media for customer service, it is also advisable to report on service metrics such as net promoter score (NPS), customer satisfaction score (CSAT) and resolution time.
Naturally, you may include additional data if it is pertinent and if you deem it essential for accomplishing your objectives. Just make sure you really need them so as not to clutter the report with irrelevant information.
Specific web metrics
Below we will detail those metrics that are usually associated with some of the websites that are most commonly included in social media reports:
– Web / Blog: Page views, visits, visitors, posts and comments.
– Facebook: Likes, followers, impressions, page views and posts.
– Instagram: Followers, following and posts.
– Google Business Profile: Direct, indirect, chain and total.
Results by network
If you want to go even deeper into the social network report, in the “network results” section we can include specific results for each social network.
The exact data to be incorporated in this section will be determined by the objectives and performance indicators that have been included earlier. Here are some of the most frequent figures to be included for each of our social media platforms:
– Number of posts.
– Net follower gain or loss.
– Engagement rate.
– Click-through rate.
– Top performing posts.
Regardless of the metrics we choose, it’s important to provide some past results for context. After all, the data doesn’t mean anything on its own. If for example you are running a social media report on a campaign, look for a previous campaign that is similar to compare your results.
Similarly, if you have to create a social media report on a weekly or monthly basis, I recommend that you track your results compared to previous weeks or months. This will allow you to see ongoing trends, as well as compare your results to the same period in the previous year to account for any seasonal trends.
Importance of Social Media Reporting
Use social media reporting tools to produce effective and timely reports. Try to keep track of all your reports because all the old reports will help you track the progress of your brand.
Helps you come up with meaningful content strategies
Social media reports serve as a blueprint for assessing the performance of your content on social media, allowing you to identify shortcomings in your content strategies. You can examine the most successful posts to determine what worked well and take note of the ones that didn’t perform well. By conducting this analysis, you can gain insight into what the audience finds interesting and what is effective in your specific field.
It helps you see which social media platform is working in your favor
Organizations and companies that utilize multi-channel approaches to market their goods and services must monitor several platforms closely. Social media marketing reports help you understand which platforms are working well for you. Engagement rate, share count and sales will help you understand which platform you should work on.
Helps you understand the pulse of the audience
Your brand’s performance will be clearly visible in the reports and this will indirectly tell you if you are chasing the right audience. The performance of your posts reflects how your audience is consuming the brand’s content. Brands can improvise on their audience targeting and consequently increase the performance of their social media marketing strategies.
Gain crucial insights about competitors in your industry
Social media reporting also involves analyzing industry competitors and tools like Unbox Social have a dedicated solution for competitor tracking.
Social media reports can also comprise data on competitors. Understanding the actions that your competitors are taking to attract their audience can assist you in developing effective strategies for your brand. Furthermore, this analysis can uncover the areas where your competitors are not leveraging their social media presence.
It can prepare you for crisis management
Social media is a complicated world and many times brands and companies end up making mistakes on it. Whether it’s posting something offensive or something unwelcome and irrelevant to the audience, it all needs to be handled well no matter what. If you have social media reports, you can find out if similar mishaps have happened before and how they were handled. This will better prepare you.
Tips and guidance for creating a Social Media Report
When creating a social media report, I recommend that you follow these 3 simple tips:
– Make them simple and make it easy to interpret all the data it provides.
– Focus on KPIs as they are the best measure of the level of performance of a process.
– Know your target audience, so that you know in advance those fields that can be more interesting for the future of the company.
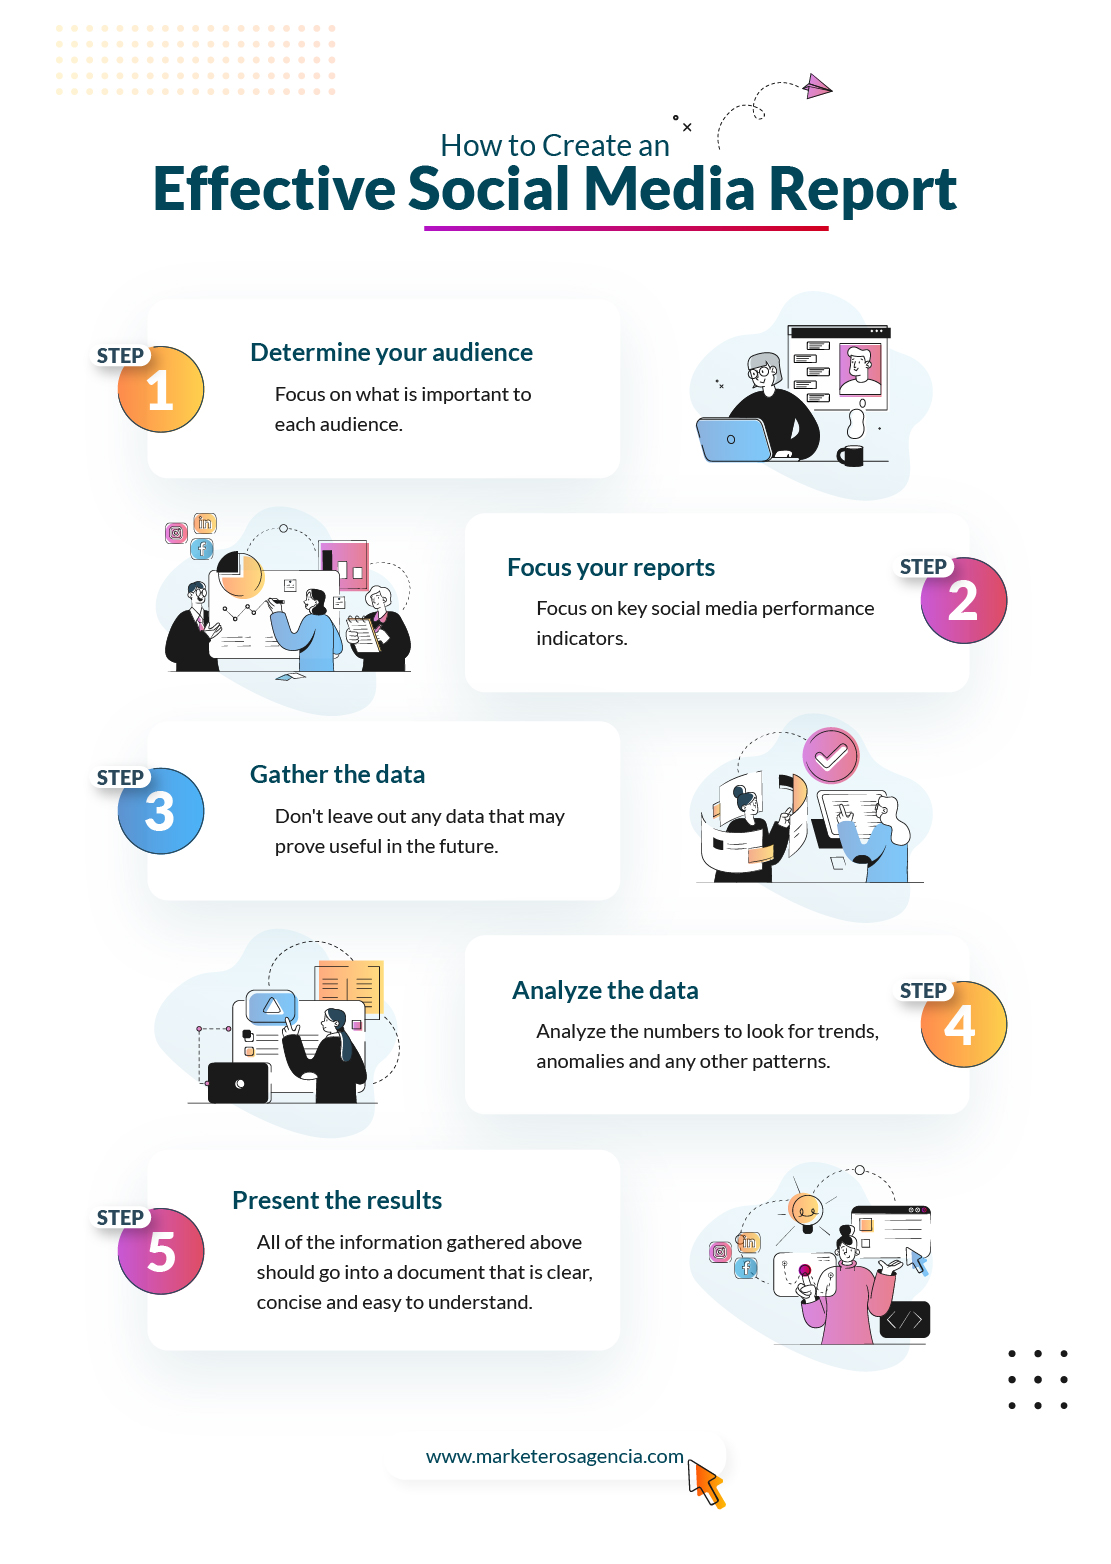
To create a social media report I recommend the following steps:
Step 1: Determine your audience
Is the social media report intended for your boss, your marketing team or is it just for you?
Focus on what’s important to each audience, rather than forcing everyone on the team to review a general report in order to find what’s relevant to their tasks. The higher your position is within the company, the more brief and concentrated your report ought to be.
Step 2: Focus your reports
Social media can be a valuable tool for promoting our company, generating sales and leads, increasing engagement, and more. The benefits are so numerous that the list almost appears to be never-ending.
We need to make sure we focus on the key performance indicators of social media, as well as the metrics that matter most to your company and the stakeholders you report to. Unless there is a significant increase or an extraordinary event, refrain from being overly occupied with reporting additional statistics.
Step 3: Gather the data
Social data comes from many sources. More on where to find the data you need later.
Step 4: Analyze the data
Raw data is not much use. So following the sections described above, we’ll analyze the numbers to look for trends, anomalies, and any other patterns that give us a clear picture of what’s working and what’s not.
Step 5: Present the results
All of the information gathered above should go into a document that is clear, concise and easy to understand. Once all the essential elements are included, we can confidently say that we have a comprehensive social media report.
Social Media Report Templates
To create your own social media report template, I recommend that you keep these couple of options in mind:
1- If you’re going to focus primarily on the numbers, you can create a template in Excel or Google Sheets. To create more analytical reports, gather data using a spreadsheet and subsequently display it in a Google document or presentation.
2. Another viable option is to make use of a social media reporting tool like Hootsuite Analytics to create custom reports. In doing so, you will have access to readable charts and graphs that can be effortlessly exported to a spreadsheet, PDF, or PowerPoint.
Useful tools when creating Social Media Reports
Below we will look at a list of 9 social media analysis and reporting tools in order to find the right solution for our business. We will learn how to manage Instagram and Facebook, as well as the rest of social networks.
Facebook Insights
Facebook Audience Insights gives us global information about two groups of people (one of people connected to our page and another made up of people on Facebook) so we can create content that captures the attention of customers and easily search for people similar to your current audience.
See breakdowns by age and gender, education levels, job titles, relationship statuses and anything else you can think of and think is useful. Gain a deeper understanding of people’s interests and hobbies in order to optimize your campaigns and attain your marketing objectives.
In short, Audience Insights combines sentiment and location information to show us the types of people interested in your business.
Twitter Analytics
To use this tool, simply open your Twitter profile and click on the three dots icon in the menu, then click on Analytics.
There we will find key data in the main analysis screen that can help us when making a social network report.
If you require more comprehensive data, select the options located in the top menu of your Twitter Analytics screen. Once there, click Export Data to export the information as a .csv file so you can add it to your social media report.
Instagram statistics
The statistics of our Instagram account are a series of data capable of providing us with valuable information with which to grow our community on the social network.
And is that, in addition to inform us about the content of interest to our followers, test and see the results of the contents, it is also of great importance in relation to the empowerment of our personal brand.
In short, Instagram statistics will help us to build loyalty and grow our community.
LinkedIn Analytics
To access them, we will open our company page and click on “Analytics” in the top menu, then choose “Visitors”, “Updates”, “Followers”, “Competitors” or “Employee Advocacy”.
With this we will have access to metrics such as page views, impressions and engagement rate.
LinkedIn Analytics offers an interesting feature that should be taken into account when we make our social media reports. And that is that if we choose the competitor analysis page, we can see how it compares us with up to nine other pages.
To export your data as an .xls or .csv file (depending on the type of data you wish to download), locate the blue Export button at the top right and select it.
Snapchat Insights
Snapchat Insights allows us to monitor and analyze our engagement on Snapchat and obtain detailed information about the audience we have on this social network. This allows us to refine our social strategy.
By measuring and understanding the performance of our Snaps, we will be able to adjust and optimize our Snapchat strategy for even greater results. In addition, with Snapchat’s analytics tool, we will be able to determine the ROI quickly and easily.
Pinterest Analytics
Pinterest Analytics is a tool of the social network itself that allows us to analyze how your pins and reels are performing. Thanks to it we can keep up to date our marketing strategy and see interesting data such as clicks on your pins or links created.
A minor drawback of Pinterest Analytics is that in order to access and utilize the analytics within Pinterest’s tool, you need to have a business account. Once we have registered a business account on Pinterest, we can access our analytics in two ways:
1. From the computer: accessing from the top.
2. From the mobile: accessing through the tab of your profile.
Hootsuite Analytics
With the aid of Hootsuite Analytics, it is possible to gather data and prepare reports for various Facebook, Twitter, Instagram, and LinkedIn accounts from a single control panel.
It allows us to customize our dashboard to track the metrics we have identified as most important for our social media reporting, including team and time metrics.
When it comes time to create the report and share the data, we have the option to customize what information to include. You’ll see that you’ll have access to a large selection of charts that describe the content of your report in a very visual way, so that the information is easy to consume and will enter well through the readers’ eyes.
It also allows you to share reports with team members directly through the Hootsuite Analytics interface. Alternatively, you can download your entire social media report in a format of your choice, such as PDF, PowerPoint, or spreadsheet, making it ready for sharing.
Conclusion
So much for this step-by-step guide to creating your own social media report.
Remember, whether you’re making a presentation to your company’s management, updating a client, or simply sharing it with another department… make your reports easy to read and understand.
Do not underestimate the value of a well-generated social media report, as it will help you both in your dealings with clients and in the organization of your company’s various projects.